

Sharing the Marie Sklodowska-Curie experience
|
How we use gene expression to understand disease  This issue of our Science Untangled will focus on how we can use molecular biology to understand more about disease. In iPLACENTA we are interested in the causes of pregnancy pathologies; the juice of the matter is really to understand what's different between a healthy placenta and an unhealthy placenta that will cause the mother to develop a disease, putting both mother and baby in danger.
Or rather, the differences become obvious too late, once the disease has already taken hold and the patients are in danger. In Dick's dystopian fantasy, the police has devised an interrogation method that will put the androids in a corner and force them to reveal themselves. In molecular biology, when we want to better understand what is going on inside an organ or a tissue, we often interrogate gene expression, looking for clues. Gene expression Like any other tissue, the placenta is made up by different types of cells, each type with its own function that will contribute to the placenta working smoothly. All cells in our body contain the same, identical genetic material in the form of DNA, packaged in chromosomes inside the nucleus. 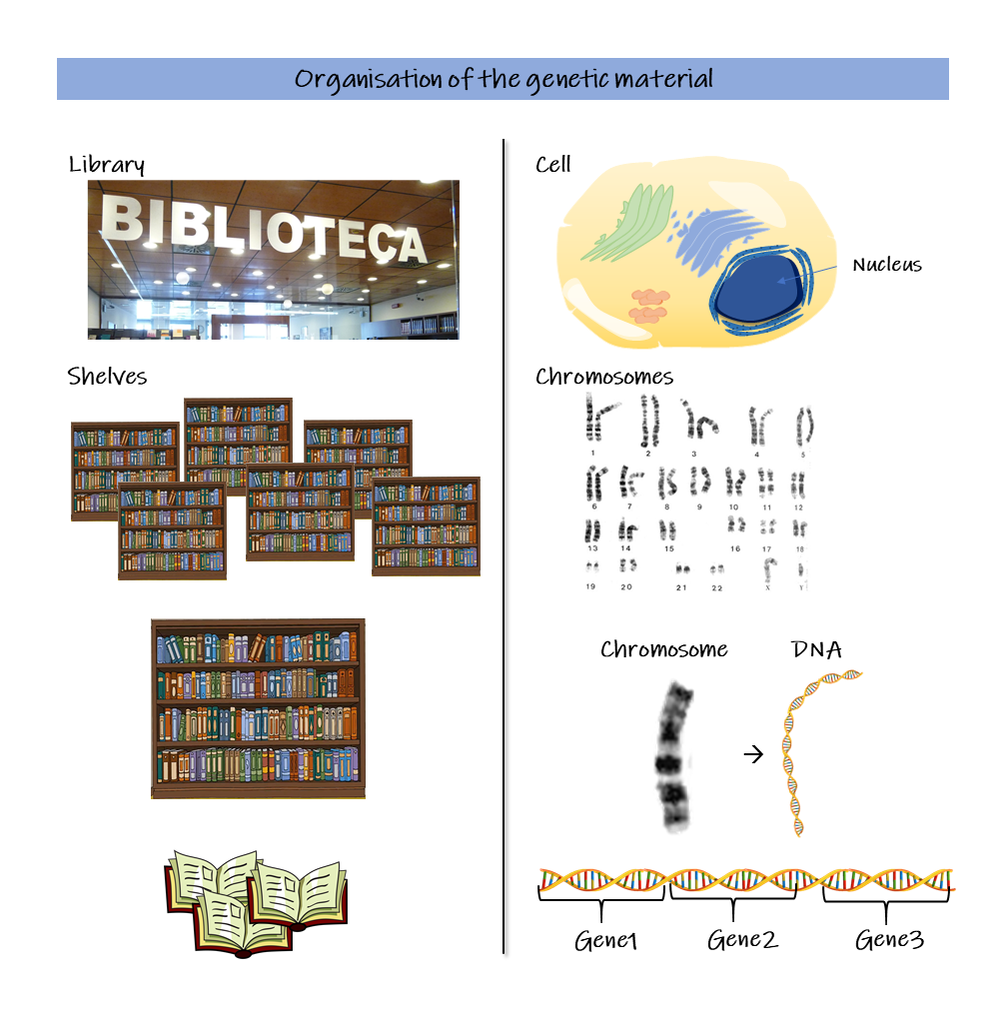 The nucleus works as a library, storing on shelves – the chromosomes – hundreds of different books, which are the genes. It is the DNA molecule that contains the actual sequence of the genes. Each cell is different because it uses a different set of genes which instruct on how to perform different functions, just like a biology student and a history student read different sets of books. When a gene is read, it is activated: it is first transcribed into a copy, the messenger-RNA, so as to ensure that the original is kept safely away on the shelf, such a gene is now expressed. Depending on the cell we are looking at, for each expressed gene we have a certain number of messenger-RNA copies, this number is what we refer to as the level of expression of the gene. Therefore, when we measure gene expression, we are indeed measuring the number of copies of each of these genes. 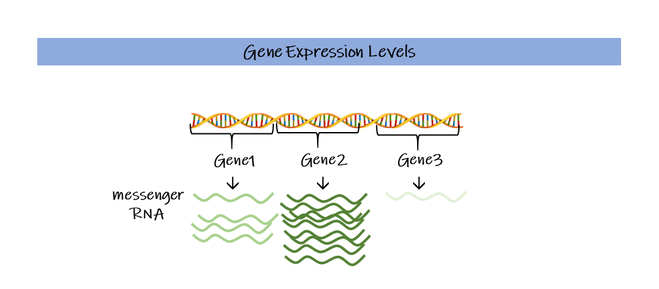 When there is a disease, the level of expression of genes and even which genes are expressed can change. By comparing healthy persons and patients with a disease we can start to spot some differences. In a normal placenta for example the HTRA4 gene is expressed relatively at a high level. However, when the mother develops the pregnancy condition called preeclampsia, these levels go up by 50 times! How do we actually measure gene expression? In the human genome, there are more than 40,000 genes that have been identified to date (Willyard, 2018). To gain as much information as possible we wish to measure gene expression at a global level, for this purpose the two techniques generally used are microarray and RNA-sequencing. Below a quick overview to get a taste of both! If you are interested in knowing a bit more about the nitty gritty of these techniques, then read on the next paragraphs, otherwise you can directly skip to the next section The outcome. 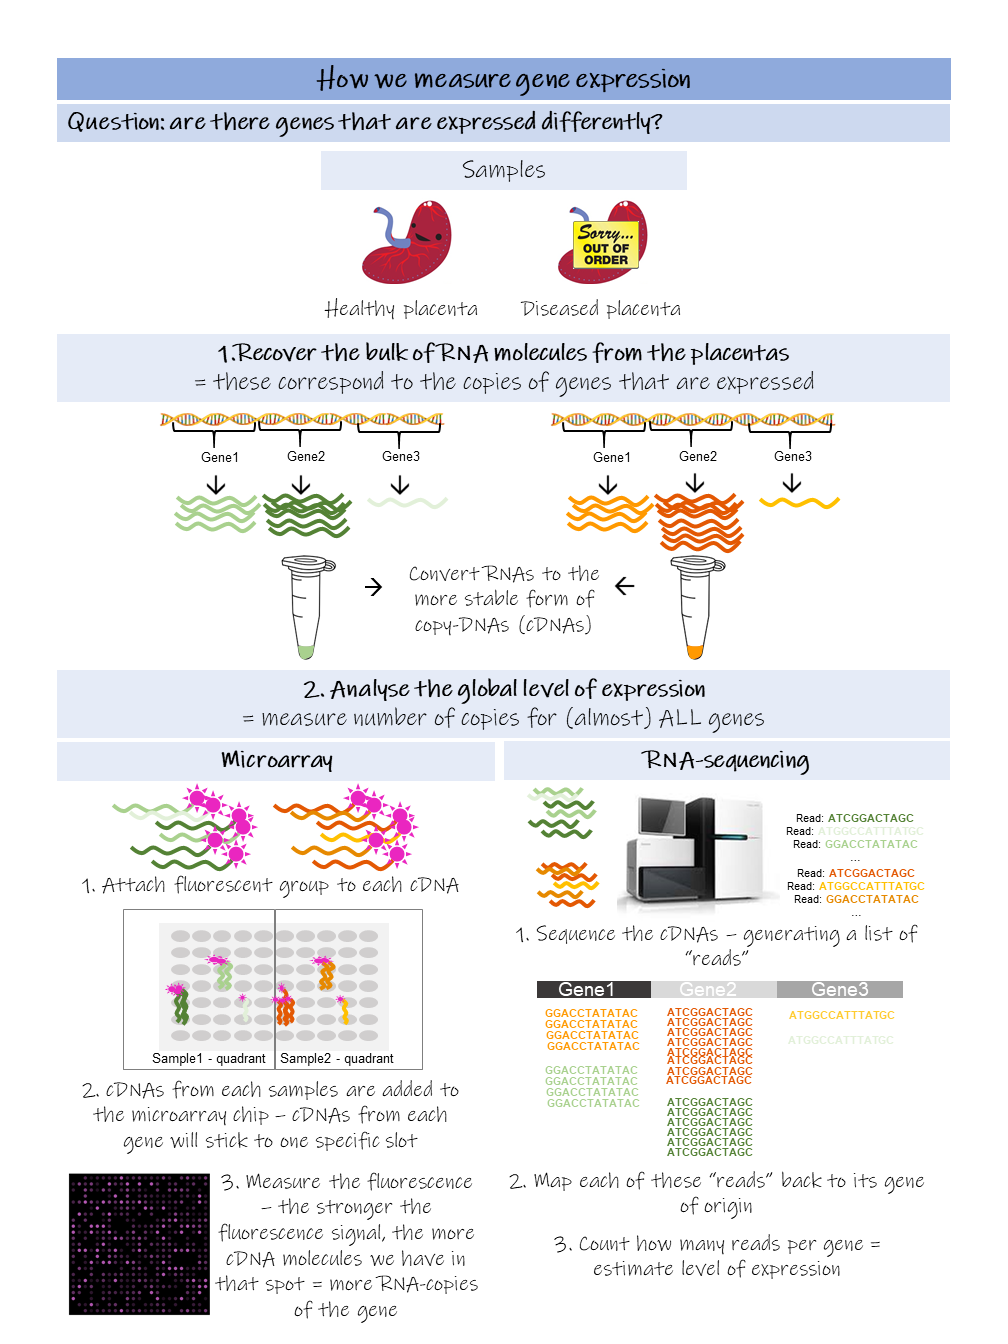 The aim is to measure gene expression levels, for as many genes as possible. First, we collect the RNA molecules from the organ/tissues that we are interested in studying and from the patients we want to analyse. These RNA-molecules correspond to the copies of the genes and generally tell us how much a gene is used. Before carrying on, we need to convert these RNA-mixes to a more stable kind of molecule, the DNA, in a process called reverse transcription. This step is very easy to carry out since many kits are available on the market and the scientists are just left to mix all the ingredients together (without screwing up!) and wait for this reaction to occur. These converted molecules are called copy-DNAs (cDNAs) and are equivalent to the original RNA-molecules we had. Now we can either do microarray or RNA sequencing (or both, if we have the money!). Microarray.
RNA-sequencing.
The outcome The final result of both techniques is a list of genes that are expressed at different levels in disease compared to healthy organs. Among these genes, some are found to be expressed at a lower level – down-regulated, while others are increased (like the case of HTRA4) – up-regulated. What do we do with this info? Our overriding goal is to understand what is happening in these organs and what is happening differently in disease. Now we have quite a detailed overview of all genes that are behaving differently, but how can we interpret this information? Usually, from a gene expression study such as the one that we described here we get quite big lists of changed genes, from hundreds to thousands, and in a first instance looking at this list voice by voice would drive us mental pretty quickly. So, we look for clues (again!): we group and categorise these genes by the functions they are known to be involved in, performing a gene ontology analysis. Thankfully, many user-friendly softwares and websites are available for this (I am a not-so-skilled-with-computer-stuff biologist, very thankful to the programmers on this one). 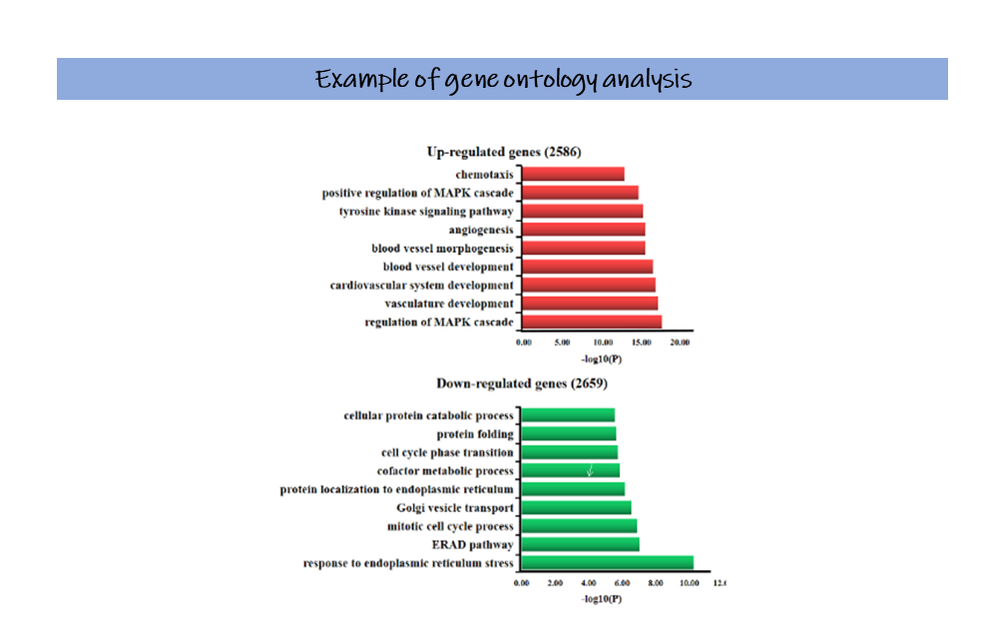 The results of this analysis look something like the real-life example on the left, which comes from the work of Han et al. (2019). Now, rather of than a list of thousands of genes, we have a finite list of functions that appear to be affected by the disease, things like cell growth, metabolism, response to stress. How does disease affect these functions? Or could it be that the changes we see in these functions are causing the disease? Time to put the thinking cap on and come up with new, original, (smart?) hypotheses to test! Some final considerations We have gone through ways we can use to identify and try to understand diseased organs (kudos to you for sticking it to the end!). Differently from the grim fate of those androids, who once identified would be certainly eliminated, our hopes for the unhealthy placentas are much brighter, we want to understand so to be empowered to develop novel new successful treatments. “We need not to be let alone. We need to be really bothered once in a while. How long is it since you were really bothered? About something important, about something real?” ― Ray Bradbury, Fahrenheit 451. References Han, K. et al. (2019) ‘Genome-Wide Identification of Histone Modifications Involved in Placental Development in Pigs’, 10(March), pp. 1–11. doi: 10.3389/fgene.2019.00277. Willyard, C. (2018) ‘Expanded human gene tally reignites debate’, Nature, 558(7710), pp. 354–355. doi: 10.1038/d41586-018-05462-w. Author Clara Apicella is an Early Stage Researcher of iPlacenta. Read her earlier blog post here.
Camino
6/5/2020 11:58:45 am
Super nice article Clara!
Clara
12/5/2020 11:14:10 am
Thank you Camino :D!!
Veronica
23/5/2020 09:20:09 am
It's amazing and extremely useful to me! Thank you, Clara. Leave a Reply. |
About the blogBeing a PhD student in a European training network is a life-changing adventure. Moving to a new country, carrying out a research project, facing scientific (and cultural) challenges, travelling around Europe and beyond… Those 3 years certainly do bring their part of new - sometimes frightening - but always enriching experiences. Categories
All
Archives
December 2021
|

 RSS Feed

15/4/2020
4 Comments